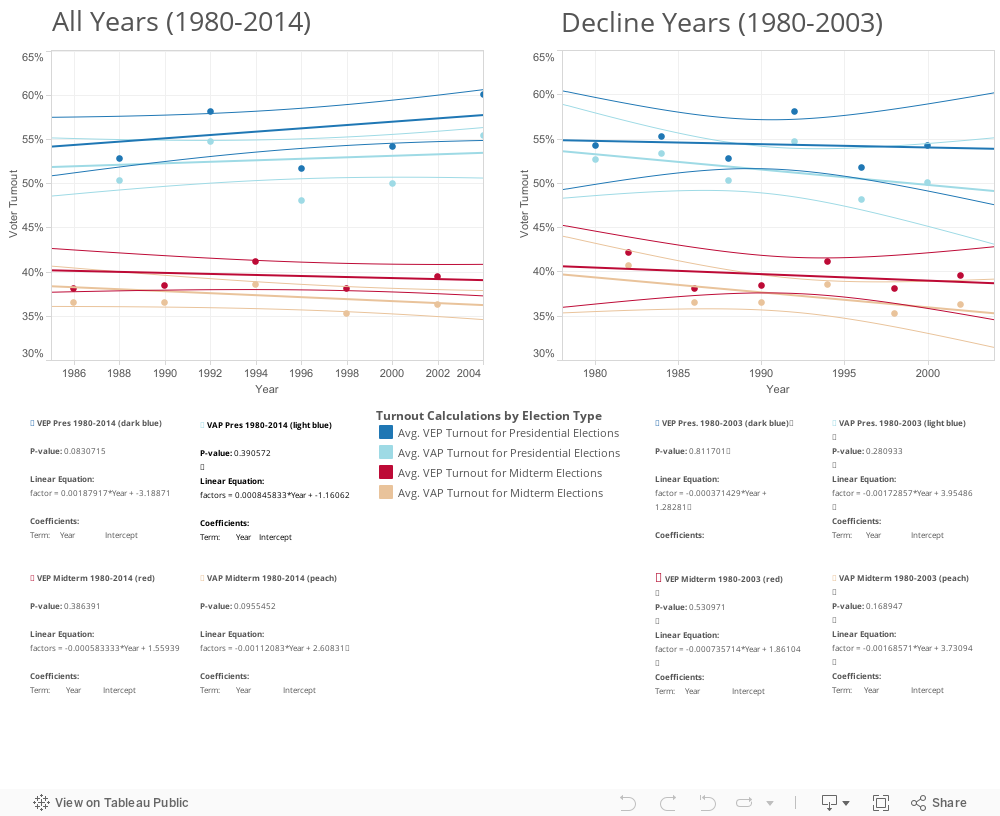
Fig. 2.1. Increase or Decrease in Voter Turnout?
In this graphic, we examined whether voter turnout rates are inclining or declining. Our non–graphical analysis of the McDonald's VEP data from 1980–2014 reported an upward trend. However as children of the 1980–90s, we grew up in an America where 'officials' frequently lamented declining voter turnout. In fact, I approached this analysis with the ingrained bias that no living American generation could match the civic moral force of pre–1970s voters.
So we did what Poly students do – crunched some numbers.
Fig 2.1 plots turnout rates for VEP and VAP calculations per election year (dots) and linear regressions (thick trend lines) with confidence estimates (thin lines). For these graphs, we grouped our data by election year type – presidential or midterm election years. The VAP method created lower turnout rates in general. However, between 1980 to around 2003 (prior to George W. Bush's first election) turnout rates do appear to be declining regardless of method of calculation.